How view determines well-being and value
November 7, 2022

Topics
With a digital twin of Switzerland’s building stock, we are able to derive a range of view-metrics, such as a building’s visual share of a lake. This allows us to measure the financial impact of visual elements on housing prices at a previously unattained level of resolution. We find that large views of lakes and cities in the far distance have the strongest impact on the sale price; however, we find the financial influence of the studied visual elements are highly-context dependent. The analysis provides a rich picture of how visual quality varies across the Swiss building stock and within a given building.
View in Real-Estate
View qualities are commonly understood to play an important role in how individuals perceive landscapes and how they make decisions. Recent neuroscience research highlights for instance the unconscious influence of fractal patterns on visual perception and well-being. Optimal fractal dimensions (i.e. nature scenery) greatly reduces stress and induces the release of endorphins (Brielmann et al., 2022). Further, distant backgrounds (>1km) tend to command a greater share of people’s attention than objects in the mid-ground (150-1km) (Hull & Stewart, 1995). Both the aspect of depth perception and visibility of fractal patterns (such as trees) are thus relevant aspects to consider in the context of the built environment. This is backed up by urban health and indoor research indicating that a high-quality window view improves a workers mental state and sleep quality, reduces stress, and boosts creativity (Al Horr et al., 2016; Frontczak & Wargocki, 2011).
What we see not only influences our well-being, but can also have an effect on rents or real-estate value. View and visual quality metrics explain price differences in Geneva multi-family (Baranzini et al., 2008), as well as Manhattan office rentals. In the latter case, office spaces with high access to views had a 6% net effective rent premium compared to spaces with low view access (Turan et al., 2021).
While previous analyses have highlighted the revealed preference – higher premiums – for high-quality window views, they have, for the most part, focused on smaller case-studies, relying on simplified proxy variables. Thus, with the new ability to quantify the view with orientation-specific and 3D-based metrics, we have the opportunity to analytically evaluate the financial value of a view at a higher resolution and with larger geographic coverage.
Our view data: Derived from a Digital Twin
Digital twins or simulated 3D urban environments allow researchers to capture information based on elevation and orientation, enabling a more comprehensive and quantitative definition of a view. Our view database consists of 32 mio. viewpoints from building facades across Switzerland. Each point represents the visual landscape as seen through a virtual window, allowing the quantification of a view in terms of the composition and configuration of visual elements.
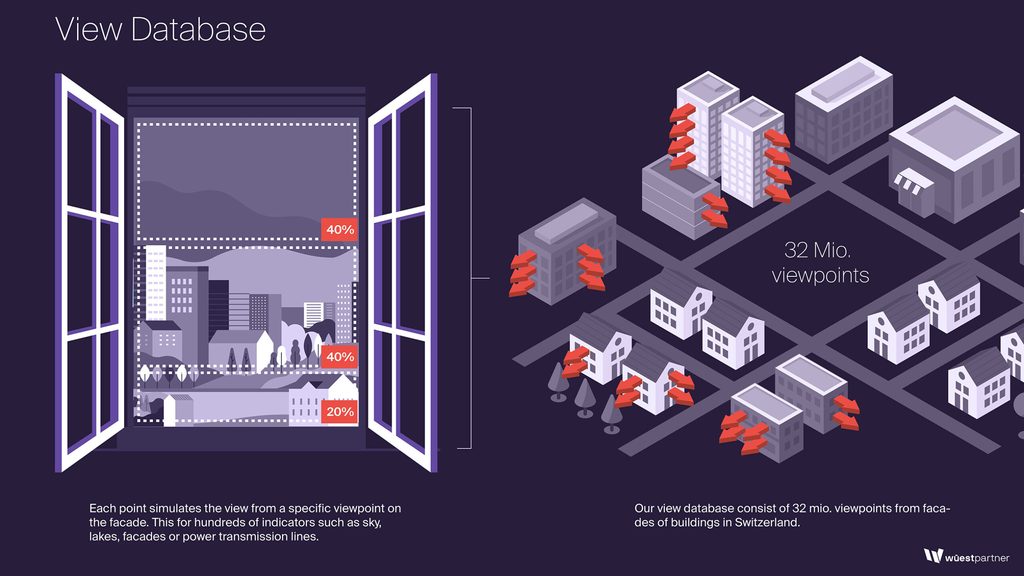
Concretely the Digital Twin consists of an exact 3D representation of all buildings and topologies, view-relevant point of interest data, such as mountains, nuclear power plants, power transmission lines, and different land surface types such as roads, forest, lakes etc. This allows us to model what is visible from different floors from every side of the building. One viewpoint contains the information about the share of facades, roofs, lakes, vegetation and undesirable structures, such as high-voltage power transmission lines.
Visual landscape elements can vary in scarcity. For instance, a meager 4.6 % of the Swiss building stock has a 1% view onto a waterbody (e.g. river, lake); whereas 57.6% has a 1% view of nature. Abundance of such visual elements further varies by location; for instance, the average building in Basel will have a 18.7% view of vegetation, compared to 26.7% in Geneva.
Urban form and natural terrain play a significant role in determining the local supply of views. If we consider the coastal cities of Lausanne and Zürich, and examine solely the distribution of lake-views; a few interesting patterns emerge: Buildings in Lausanne are not only more likely to have lake-views, but also tend to have a larger visual share if they do. However, there are proportionately more buildings in Zürich with exceptionally good lake-views (total share of over 10%), indicating a higher degree of inequality with respect to access to lake-views across these two cities. Considering the location of the buildings with the best lake-views, it becomes evident that, while the hilly topography of the north-eastern shore of Lake Geneva (Lausanne, Lavaux, Vevey, Montreux) increases the propensity of above average views far away from the lake, the clustering within 1.5 km of the lakeshore in Zürich creates a natural scarcity of high-quality lake-views.
Economically, scarcity of goods typically results in a higher willingness to pay which may contribute to the competitiveness of Zürich’s housing market. These observations are of course intuitive, however, the ability to quantify the national supply of views opens up new avenues to measure our cities and improve the accuracy of property evaluation models.
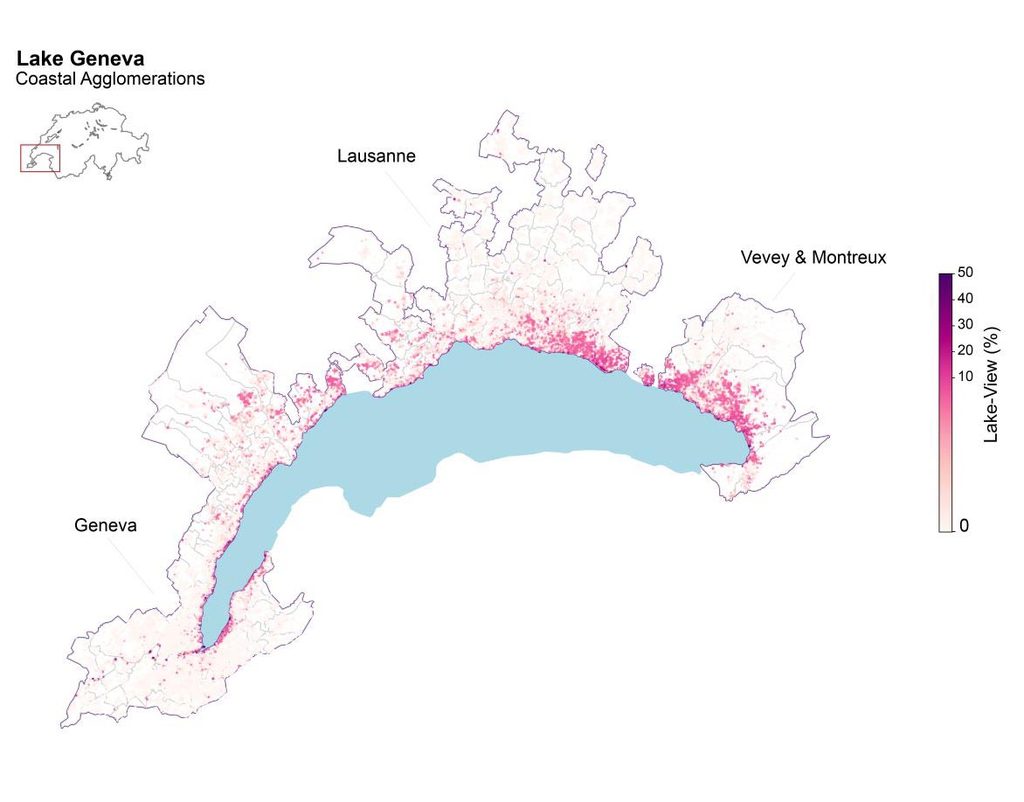
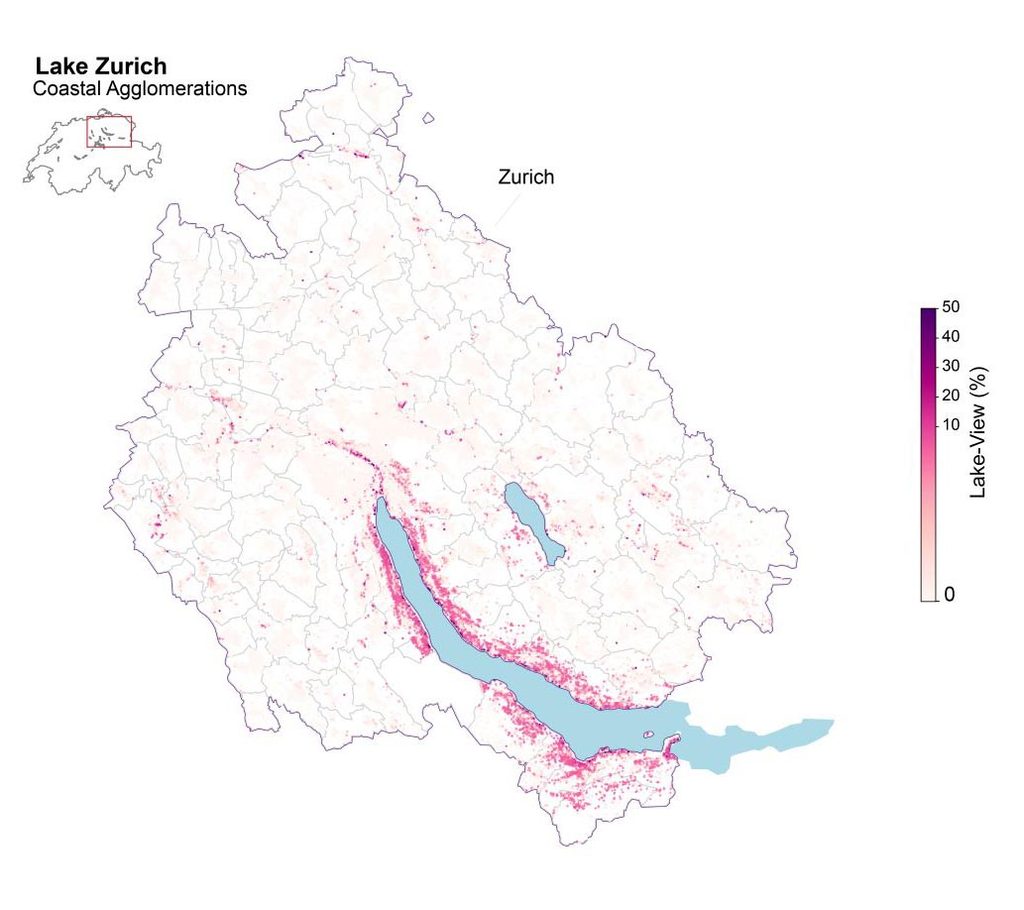
Plotting the geographic footprint of lake-view buildings, colored by the size of their respective largest view, reveals the differences in supply of lake-view buildings, between Lake Geneva and Lake Zürich.
View influences Home prices in Switzerland
We examine the effect of different visual elements in Switzerland on house prices. Specifically, we define our set of view attributes as the maximum visible share of a selected variable for a given building; e.g. a 5% lake-view. Controlling for standard structural, accessibility-, and environmental characteristics, we use the hedonic pricing model (Rosen, 1974) to determine the implicit price of our attributes of interest. Under this model, we find that homes with a larger view of a lake command an 11% premium on average; whereas larger views of nature, on average, trade at a 1.6% discount. Yet, a closer look reveals that while particular visual features, (i.e. lake-view or view of a city in the distance see figure), have large price effects that are globally true, others vary spatially and are highly context-dependent. For instance, larger views of nature trade at a 1% premium in wealthy-urban areas; as opposed to a 1% discount in the peri-urban neighborhoods of mid-sized cities.


The x-axis shows the highest value (share as %) per building of the respecting view element. The y-axis shows the predicted valuation (in thousands of CHF) of a single family home with a given visual share, while controlling for other predictors used in our hedonic model. Left: Marginal effect of a view of building elements in distance (1km). Right: Effect of lake-view on transaction prices.
From macro- to nano-location
When describing the location of a property, the distinction between macro- and micro-location has been established. In Switzerland, the macro-location, i.e. the large-scale spatial classification, is usually represented by the municipality. The micro-location describes the small-scale location characteristics that differentiate within the macro-location.
In addition to the identification of a location and the assignment of the associated location characteristics, the conversion of this collected information into economic categories is of decisive importance. In this context, the value is derived from the scarcity of the spatial bundle of goods: the rarer a certain combination of desirable site characteristics occurs in an area, the higher its economic value is in principle. Thus, land with a lake-view fetches significantly higher prices than land without one, because it is rare – at least in Switzerland. A micro-location criterion only becomes price-relevant if it is also an exclusive attribute that is not available in other locations in the same macro-location.
With the growing availability of high-resolution spatial data, a third level of location quality has found its way into the valuation practice: the nano-location. This term is used to define the quality of location of an apartment within the building. E.g. an apartment on the top floor has different views than an apartment on the ground floor and a south-facing apartment has more daily sunlight than a north-facing one. The nano-location introduces an additional spread of willingness to pay within the price level of the macro- and micro-location. Our view database allows for data-driven assessment of the nano-location.
References
Al Horr, Y., Arif, M., Kaushik, A., Mazroei, A., Katafygiotou, M., & Elsarrag, E. (2016). Occupant productivity and office indoor environment quality: A review of the literature. Building and Environment, 105, 369–389. https://doi.org/10.1016/j.buildenv.2016.06.001
Baranzini, A., Ramirez, J. V., Schaerer, C., & Thalmann, P. (2008). Introduction to this Volume: Applying Hedonics in the Swiss Housing Markets. Swiss Journal of Economics and Statistics, 144(4), 543–559. https://doi.org/10.1007/BF03399265
Brielmann, A. A., Buras, N. H., Salingaros, N. A., & Taylor, R. P. (2022). What Happens in Your Brain When You Walk Down the Street? Implications of Architectural Proportions, Biophilia, and Fractal Geometry for Urban Science. Urban Science, 6(1), Article 1. https://doi.org/10.3390/urbansci6010003
Fleischmann, M., Romice, O., & Porta, S. (2021). Measuring urban form: Overcoming terminological inconsistencies for a quantitative and comprehensive morphologic analysis of cities. Environment and Planning B: Urban Analytics and City Science, 48(8), 2133–2150. https://doi.org/10.1177/2399808320910444
Frontczak, M., & Wargocki, P. (2011). Literature survey on how different factors influence human comfort in indoor environments. Building and Environment, 46(4), 922–937. https://doi.org/10.1016/j.buildenv.2010.10.021
Hull, R. B., & Stewart, W. P. (1995). The Landscape Encountered and Experienced While Hiking. Environment and Behavior, 27(3), 404–426. https://doi.org/10.1177/0013916595273007
Rosen, S. (1974). Hedonic Prices and Implicit Markets: Product Differentiation in Pure Competition. Journal of Political Economy, 82(1), 34–55. JSTOR.Turan, I., Chegut, A., Fink, D., & Reinhart, C. (2021). Development of View Analysis Metrics and Their Financial Impacts on Office Rents. SSRN Electronic Journal. https://doi.org/10.2139/ssrn.3784759